
ライブラリのインポート[matplotlib]
pip install matplotlibデータの準備
x = [1, 2, 3, 4, 5, 6, 7, 8, 9, 10]
y = [200, 100, 300, 250, 400, 700, 650, 900, 600, 1000]
データの変換
nx = np.array(x)
ny = np.array(y)
グラフの種類選択
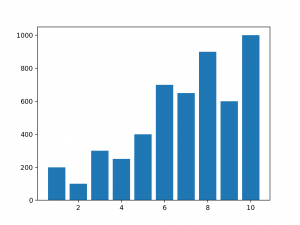
縦棒グラフ
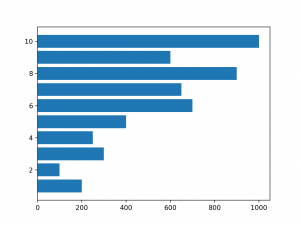
plt.bar(nx,ny)横棒グラフ
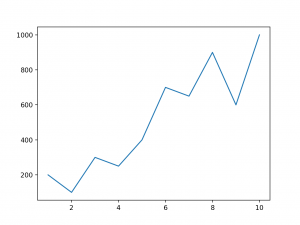
plt.barh(nx,ny)折れ線グラフ
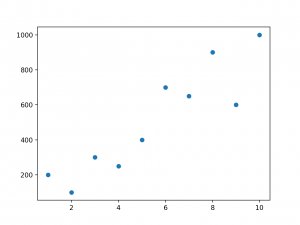
plt.plot(nx,ny)散布図
plt.scatter(nx,ny)グラフの表示
plt.show()結果
縦棒グラフ
横棒グラフ
折れ線グラフ
散布図
ABOUT ME
株式会社Playgroundのサービス
- 無料・簡単・片手でホームページを作成できる自社サービス Rakwi
- Web制作とアプリ開発を学べるオンラインプログラミング講座 Upstairs
- 開発,DX推進支援サービス スタートアッププラン